IC Markets Home Sign in Web Trader Contact Us
IC Markets Social IC Markets Social

Information Hub for
Serious Traders

  • ABOUT US
  • OPEN LIVE ACCOUNT
  • OPEN DEMO ACCOUNT
  • TRADE NOW
  • VISIT OUR BLOG
IC Markets Social
  • ABOUT US
  • OPEN LIVE ACCOUNT
  • OPEN DEMO ACCOUNT
  • TRADE NOW
  • VISIT OUR BLOG
October 18, 2022North_American_Stocks_esIC Markets

Posible ruptura del nivel de resistencia en el US Small Cap 2000 Index

El US Small Cap 2000 Index avanza hacia la línea de resistencia de un Canal alcista, que ya ha probado varias veces en el pasado. Hemos visto un retroceso antes desde esta línea, así que en esta etapa no está claro si atravesará esta línea o se recuperará como lo ha hecho anteriormente. Si el […]

Read more
October 17, 2022North_American_Stocks_esIC Markets

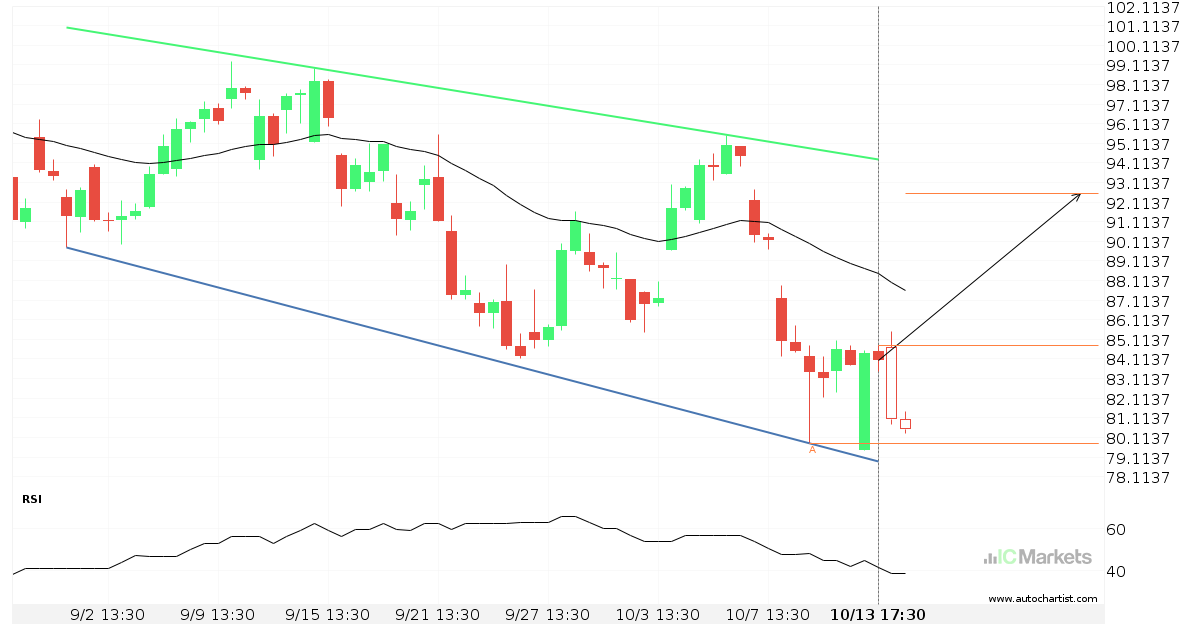
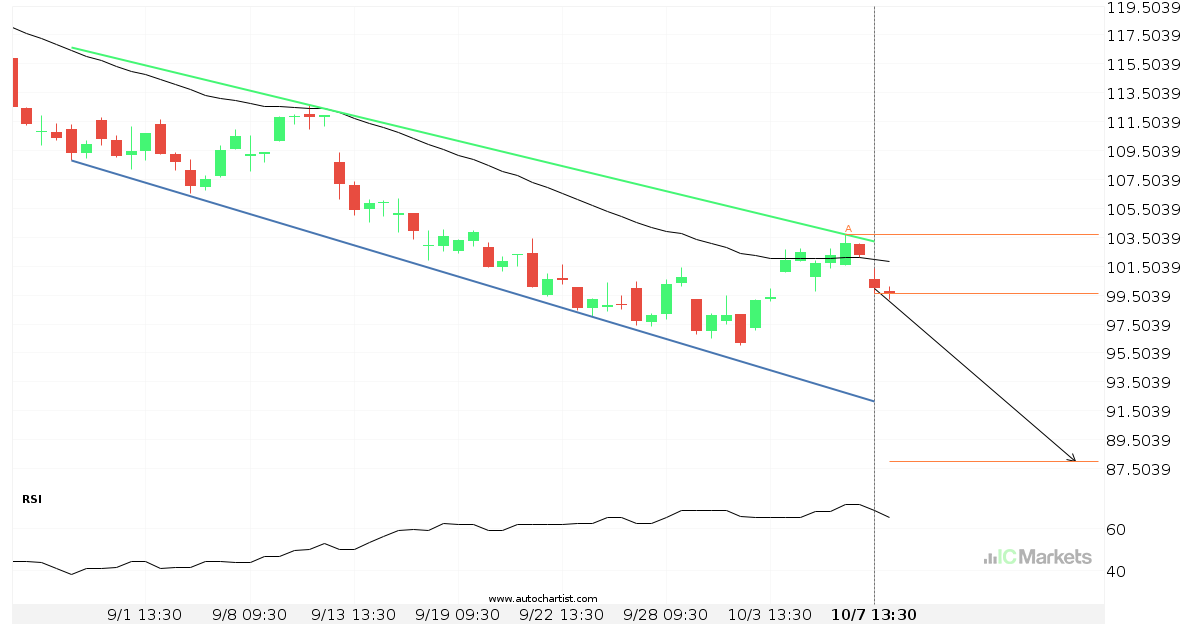
El Paypal Holdings Corp se aproxima a la resistencia de un Canal bajista

El Paypal Holdings Corp se está acercando a la línea de resistencia de un Canal bajista. Ha llegado a esta línea en numerosas ocasiones durante los últimos 43 días. Si vuelve a probarla de nuevo, debería hacerlo en las próximas 3 días.

Read more
October 14, 2022North_American_Stocks_esIC Markets

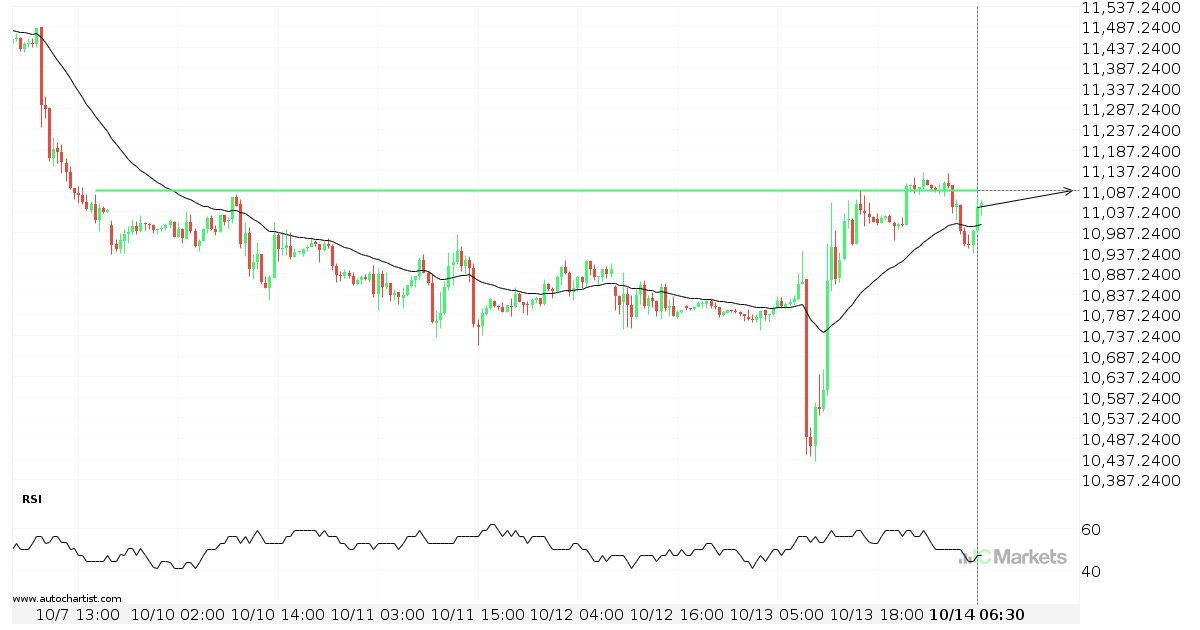
Inminente irrupción de una importante línea de precio del US Tech 100 Index

El US Tech 100 Index avanza hacia la línea de 11090.5000, que ya ha probado en numerosas ocasiones durante el pasado. Hemos observado un retroceso desde esta posición en el pasado, por lo que en esta fase no está claro si atravesará este precio o se recuperará como ya hizo antes. Si el US Tech […]

Read more
October 13, 2022North_American_Stocks_esIC Markets

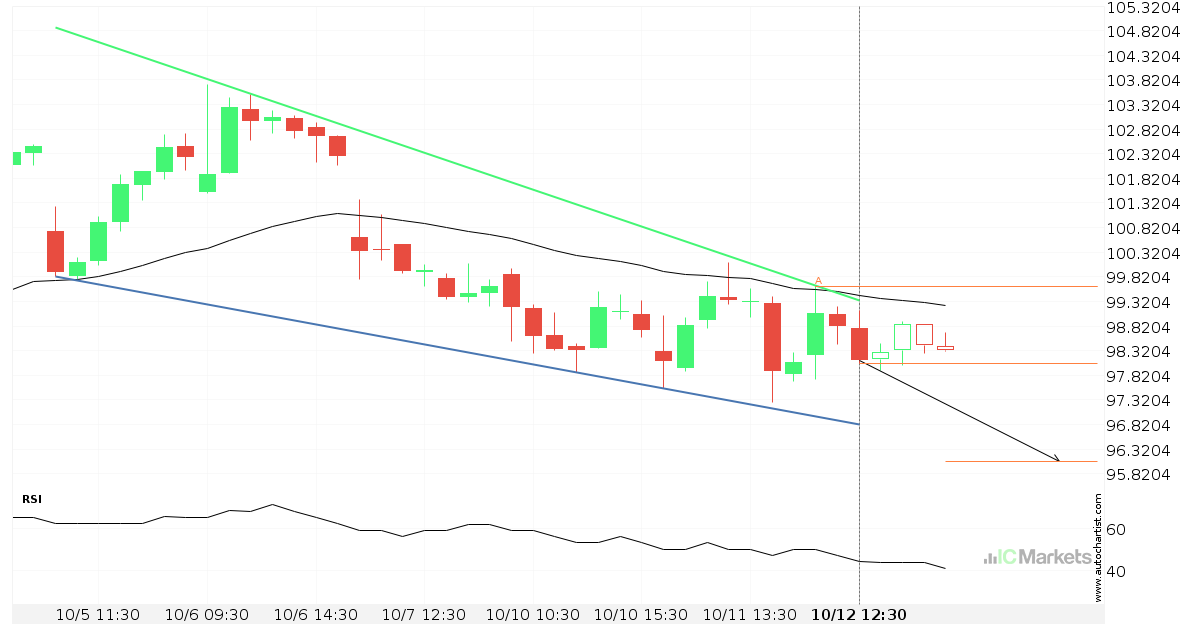
El ALPHABET INC CLASS C se aproxima a el soporte de un Cuña descendente

El ALPHABET INC CLASS C se está acercando a la línea de soporte de un Cuña descendente. Ha llegado a esta línea en numerosas ocasiones durante los últimos 8 días. Si vuelve a probarla de nuevo, debería hacerlo en las próximas 8 horas.

Read more
October 12, 2022North_American_Stocks_esIC Markets

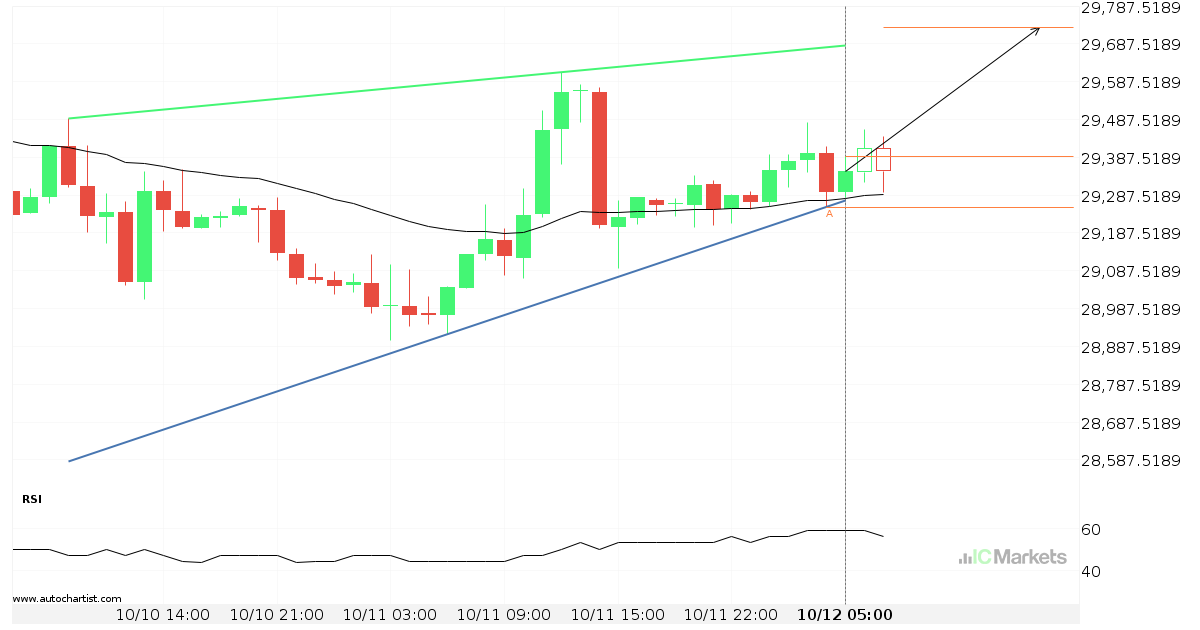
El US Wall Street 30 Index se aproxima a la resistencia de un Cuña ascendente

El US Wall Street 30 Index se está acercando a la línea de resistencia de un Cuña ascendente. Ha llegado a esta línea en numerosas ocasiones durante los últimos 2 días. Si vuelve a probarla de nuevo, debería hacerlo en las próximas 11 horas.

Read more
October 11, 2022North_American_Stocks_esIC Markets

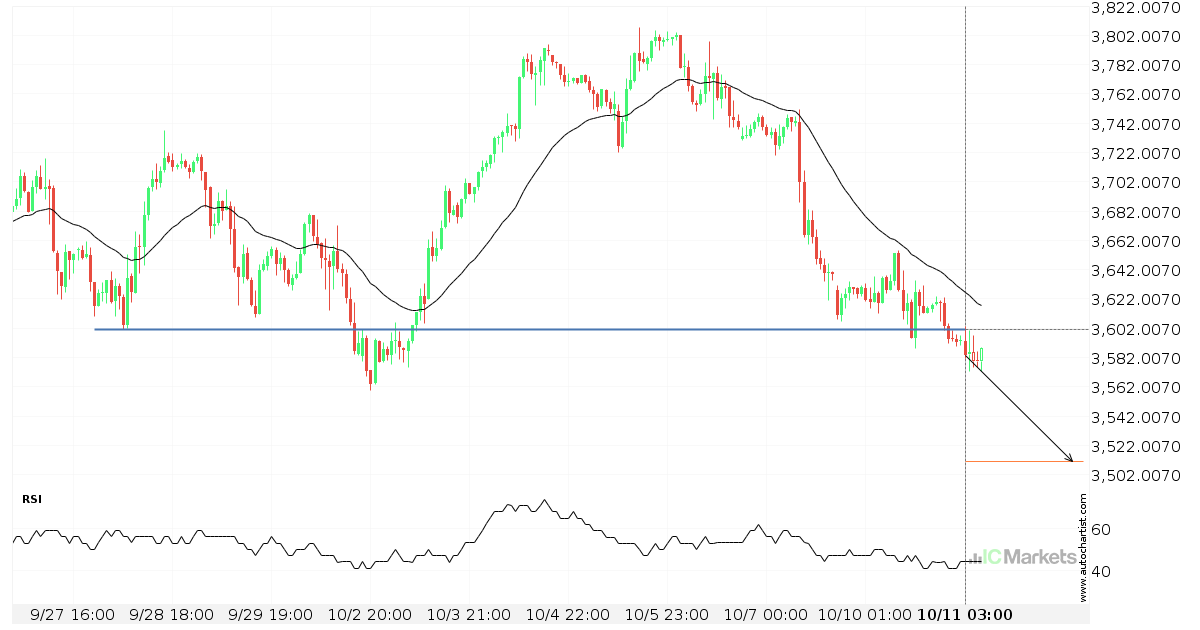
Importante línea de precio atravesada por el US SPX 500 Index

El US SPX 500 Index ha atravesado 3600.8000, que ha probado ya varias veces en el pasado. Ya hemos visto un retroceso de esta posición en numerosas ocasiones. Si esta nueva tendencia persiste, US SPX 500 Index podría dirigirse al nivel 3511.0601 dentro de las próximas 3 días.

Read more
October 10, 2022North_American_Stocks_esIC Markets

Inminente recuperación o irrupción del ALPHABET INC CLASS C

El ALPHABET INC CLASS C se dirige a la línea de soporte de un Canal bajista. Si este movimiento se mantiene, el precio de ALPHABET INC CLASS C podría probar el nivel de 88.0100 en las próximas 3 días. Ya ha probado esta línea en numerosas ocasiones, por lo que este movimiento podría durar poco […]

Read more
October 7, 2022North_American_Stocks_esIC Markets

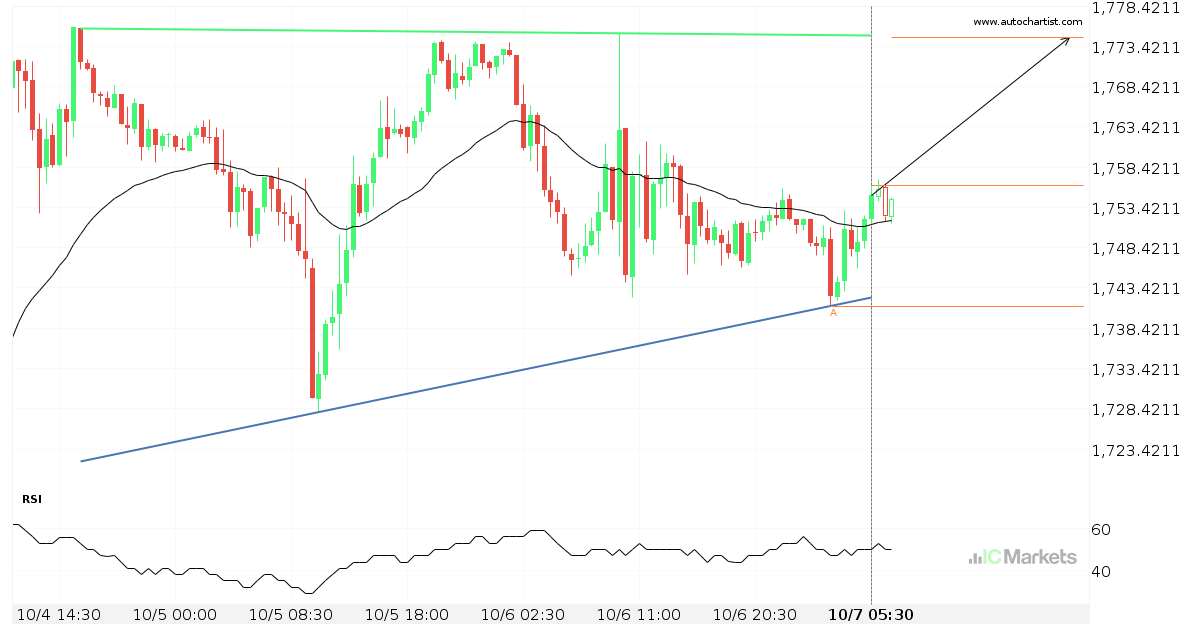
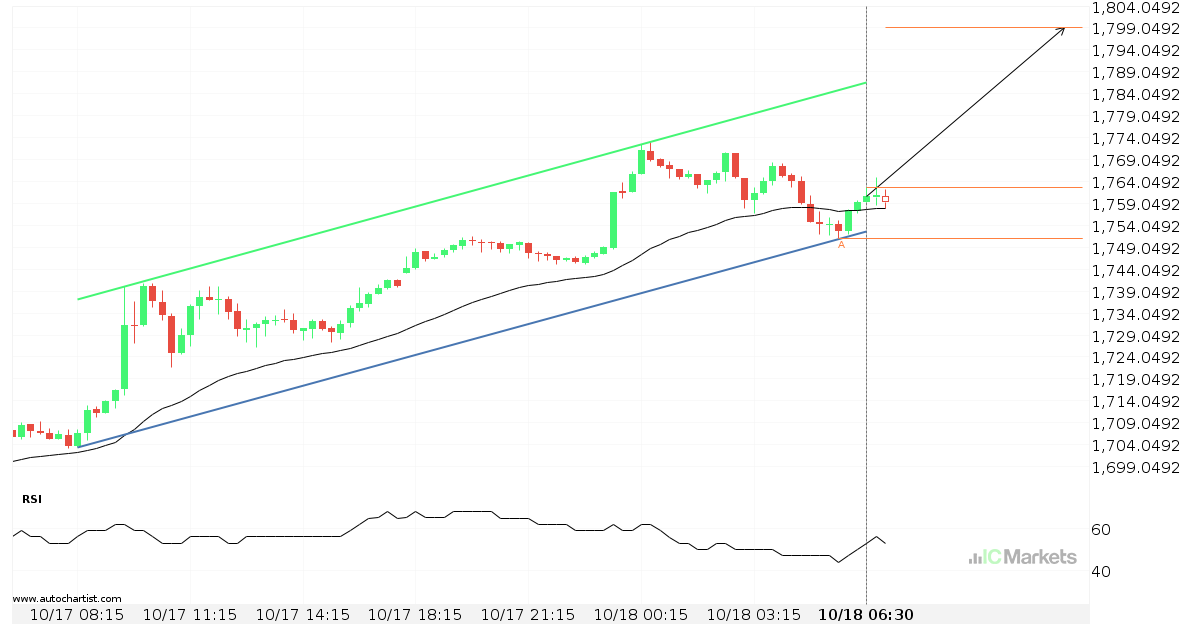
El US Small Cap 2000 Index se aproxima a la resistencia de un Triángulo ascendente

El US Small Cap 2000 Index se está acercando a la línea de resistencia de un Triángulo ascendente. Ha llegado a esta línea en numerosas ocasiones durante los últimos 3 días. Si vuelve a probarla de nuevo, debería hacerlo en las próximas 17 horas.

Read more
October 6, 2022North_American_Stocks_esIC Markets

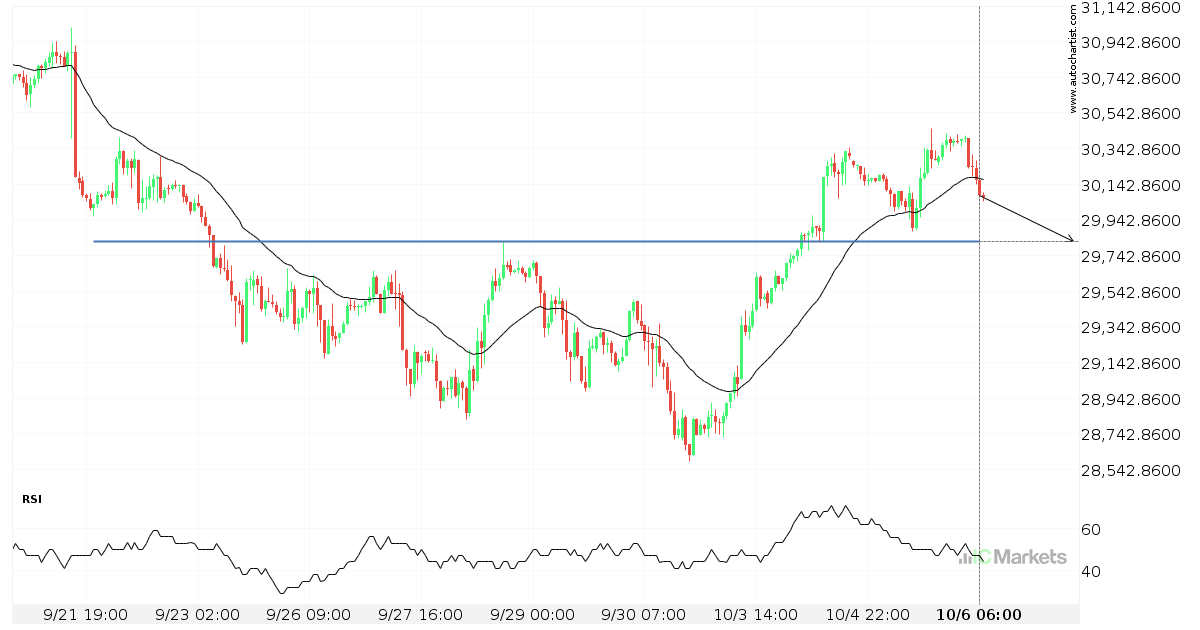
Un posible impulso final en el US Wall Street 30 Index

El US Wall Street 30 Index avanza hacia 29820.1992 y podría alcanzar este punto en un plazo de 3 días. Ha probado esta línea previamente en numerosas ocasiones y esta vez no tiene porqué ser diferente, terminando con una recuperación en lugar de en una rotura. Si la rotura no ocurre, podríamos observar un retroceso […]

Read more
October 5, 2022North_American_Stocks_esIC Markets

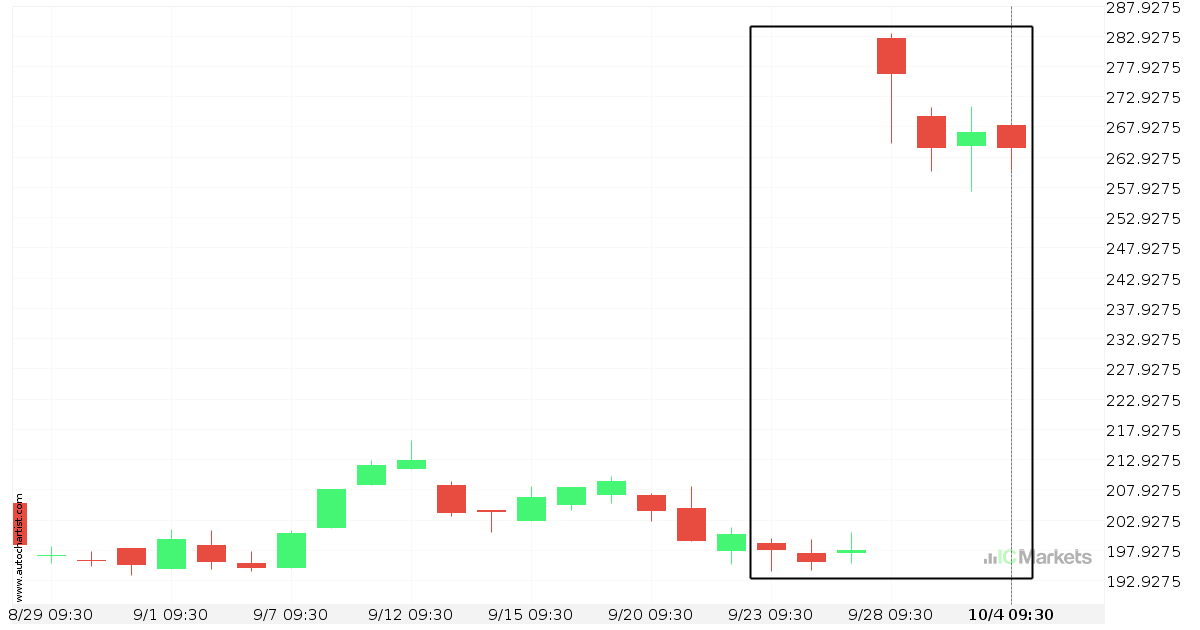
Extraordinario movimiento alcista del Biogen Idec Inc

El Biogen Idec Inc ha ascendido un 33,6% de 199.1 a 264.32 en 12 días.

Read more
  • 1
  • 2
  • 3
  • …
  • 47
  • 48
  • 49
  • 50
  • 51
  • 52
  • 53
  • …
  • 89
  • 90
  • 91

Recent Posts

  • Either a rebound or a breakout imminent on SILVER
  • GOLD Nível visado: 2976.3601
  • A potential bearish movement on GOLD
  • มีโอกาสเกิดการเคลื่อนตัวแบบ bearish บน GOLD
  • Posible gran movimiento en el AUDJPY

Recent Comments

    Translation


     Edit Translation

    Trade with

    a market leader you can rely on

    Open Trading Account Try a Free Demo

    Forex Trading

    • Accounts Overview
    • Open an Account
    • Launch Web Trader

    Trading Specifications

    • Spreads and Commissions
    • Range of Market
    • Trading Hours
    • Funding
    • Withdrawal

    About IC Markets

    • Help Center
    • Why IC Markets
    • Regulation
    • Legal Documents
    • Contact Us


    Forex Trading

    • Accounts Overview
    • Open an Account
    • Launch Web Trader

    Trading Specifications

    • Spreads and Commissions
    • Range of Market
    • Trading Hours
    • Funding
    • Withdrawal

    About IC Markets

    • Chat with a Specialist 24/7
    • Why IC Markets
    • Regulation
    • Legal Documents
    • Contact Us

    Disclaimer: This material is marketing material where all marketing material is published for informational purposes only. This material does not contain and should not be considered as containing - investment advice and recommendations, or suggestions for performing any actions with financial instruments. The built-in widgets belong to their external independent authors, and IC Markets is not responsible for their content and their impact on trade.

    All content rights reserved. Opinions of the authors may not coincide with the opinion of the blog editors. When copying materials from this site or connecting to an RSS feed to republish our articles, a link to IC Markets or attribution in the format ‘IC Markets Blog’ is required. For general questions, please contact the editorial office via the form on the Contact us page.

    Risk Warning: Trading Derivatives carries a high level of risk to your capital and you should only trade with money you can afford to lose. Trading Derivatives may not be suitable for all investors, so please ensure that you fully understand the risks involved and seek independent advice if necessary. A Product Disclosure Statement (PDS) should be considered before entering into a transaction with us.

    The contents of this page are general information only and does not take into account your personal situation, financial objectives or needs. It is up to you to make sure the products that we offer suit your specific needs. You should not trade with us unless you understand the features and risks of the products that we offer. This means that you might need to seek independent advice before you start trading with us.

    © 2022 Raw Trading Ltd | All rights reserved.
    • Sample Page